Singapore tops fDi’s Smart Locations of the Future 2019/20 ranking
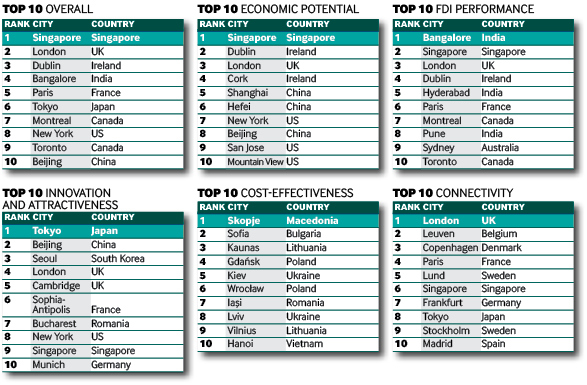
Singapore is fDi’s first Smart Location of the Future, followed by London and Dublin in second and third place. Naomi Davies reports.
Singapore has been named fDi’s inaugural Smart Location of the Future. According to data from greenfield investment monitor fDi Markets, Singapore attracted 646 FDI projects in the software and IT services and communications sectors between December 2013 and November 2018.
Download a PDF of these rankings here:
The city-state excelled in the R&D field, attracting the highest number of FDI projects (230) and the largest level of investment ($8.43bn). Norway-based software asset management company Crayon announced plans to establish an artificial intelligence (AI) centre of excellence in Singapore in October 2018, explaining that it chose to invest in the city-state because “the local AI community and ecosystem is both very advanced and dynamic, and because the development is proactively backed by the local government”.
In 2014, the Singaporean government launched its Smart Nation Initiative, which encourages investors around the world to use the city as a living lab to try out new ideas and smart solutions with global potential. The programme, coupled with Singapore’s low unemployment rate, prime credit rating and well-developed laws relating to ICT, creates a desirable environment for smart investors. The cost of establishing a business in the city is relatively low and it scores highly on the Global Cybersecurity Index. In addition, hi-tech exports make up almost 50% of Singapore’s total manufactured exports.
Europe's smartest
UK capital London is the second most promising smart city, welcoming 951 software and IT services and communications projects during the review period, which is the highest number of all locations studied. London scored extremely well for its ICT access and on the Global Innovation Index. Moreover, it is the best connected smart location, with more than 300 international locations accessible from the six airports near the city. US-based Syntasa, a predictive behavioural analytics company, invested £3.6m ($4.74m) in an expanded office at Victoria Station in January 2018, saying: “London is widely recognised as Europe’s top tech hub and home to some of the world’s largest brands.”
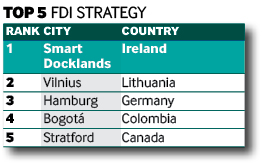
Dublin ranks third overall, and also tops the FDI Strategy category. Its Smart Docklands initiative, spearheaded by Dublin City Council and Trinity College’s Connect Centre, seeks to connect SMEs, residents and local government officials with technology companies to create a testbed for future innovation.
The scheme channels insights from a range of partners – including tech giants such as Google, Softbank and Vodafone, start-ups such as Pervasive Nation and GoCar, property developers, plus residents, universities and research institutions – to develop the Smart Docklands into a thriving part of Dublin, and accelerate the development of disruptive technologies to improve life in urban centres worldwide.
DATA POINTS:
Economic Potential
• Population
• GDP (PPP, estimated)
• GDP per capita (PPP, estimated)
• Average annual GDP growth rate (December 2013-November 2018)
• Projected average annual GDP growth rate (2018-2022)
• Hi-tech exports (% of manufactured exports)
• Unemployment rate
• Laws relating to ICTs
• Credit rating
• Ease of hiring foreign labour
• Index of Economic Freedom
• Labour force, forecast growth (annual)
• Labour productivity
• Labour productivity, average annual forecast growth (%, 2019-2023)
• Days taken to start a business
Innovation and Attractiveness
• Companies in software and IT services
• Companies in electronic components
• Companies in communications
• Companies in research and development
• Company specialisation in electronic components
• Company specialisation in software and IT services
• Company specialisation in research and development
• Company specialisation in communications
• Number of top 400 universities in engineering - electrical and electronic
• Number of top 400 universities in engineering - aerospace engineering
• Number of top 500 universities in engineering - computer science and engineering
• Number of patents (2003-2018)
• Number of patents in software (2003-2018)
• Number of patents in artificial intelligence (2003-2018)
• Patents in software as a % of total patents (2003-2018)
• Patents in artificial intelligence as a % of total patents (2003-2018)
• Number of students
• Student intensity (%)
• R&D expenditures (% GDP)
• University-industry collaboration in research and development
• Skillset of graduates
• Quality of research institutions index
• Growth of innovative companies
• Intellectual property protection
• Global Connectivity Index (2018)
• Employment in services (% of total employment)
• ICT access
• Scientific and technical journal articles
• Hi-tech exports
• Global Cybersecurity Index
• Knowledge Economy index
• Global Innovation Index
FDI Performance
• Inward FDI (December 2013 -November 2018)
• Outward FDI (December 201-November 2018)
• FDI in research and development (inward FDI) (December 2013-November 2018)
• FDI in software and IT services (inward FDI) (December 2013-November 2018)
• FDI in software R&D (inward FDI) (December 2013-November 2018)
• FDI in communications (inward FDI) (December 2013-November 2018)
• FDI jobs in research and development (inward FDI jobs) (December 2013- November 2018)
• FDI jobs in software and IT services (inward FDI jobs) (December 2013-November 2018)
• FDI jobs in software R&D (inward FDI jobs) (December 2013-November 2018)
• FDI jobs in communications (inward FDI jobs) (December 2013-November 2018)
• Capex in research and development (inward Capex) (December 2013-November 2018)
• Capex in software and IT services (inward Capex) (December 2013-November 2018)
• Capex in software R&D (inward Capex) (December 2013-November 2018)
• Capex in communications (inward Capex) (December 2013-November 2018)
• FDI in research and development (inward FDI) as a % of total FDI (December 2013-November 2018)
• FDI in software and IT services (inward FDI) as a % of total FDI (December 2013 -November 2018)
• FDI in software R&D (inward FDI) as a % of total FDI (December 2013-November 2018)
• FDI in communications (inward FDI) as a % of total FDI (December 2013-November 2018)
• Expansion/colocation FDI in research and development (inward FDI) (December 2013-November 2018)
• Expansion/colocation FDI in software and IT services (inward FDI) (December 2013-November 2018)
• Expansion/colocation FDI in software R&D (inward FDI) (December 2013-November 2018)
• Expansion/colocation FDI in communications (inward FDI) (December 2013-November 2018)
Cost Effectiveness
• Annual rent for prime Grade A office space ($ per sq m)
• Annual rent for prime Grade A industrial space ($ per sq m)
• Average salary ($) for skilled worker
• 4*/5* hotel in city centre ($ per night)
• Total tax rate (% profit)
• Corporation tax rate (%)
• Cost of establishing a business (absolute value using GNI)
• Cost of registering a property (% of property value)
• Cost of establishing an electricity connection (absolute value using GNI)
Connectivity
• Number of airports within 50 miles of the city
• Distance to nearest international airport
• Number of international destinations served from airports (across borders, without a custom check requirement)
• Internet upload speed (Mb/s)
• Internet download speed (Mb/s)
• Quality of electricity supply
• Time to obtain a permanent electricity connection
• Environmental Performance Index

Global greenfield investment trends
Crossborder investment monitor
|
|
fDi Markets is the only online database tracking crossborder greenfield investment covering all sectors and countries worldwide. It provides real-time monitoring of investment projects, capital investment and job creation with powerful tools to track and profile companies investing overseas.
Corporate location benchmarking tool
fDi Benchmark is the only online tool to benchmark the competitiveness of countries and cities in over 50 sectors. Its comprehensive location data series covers the main cost and quality competitiveness indicators for over 300 locations around the world.
Research report
fDi Intelligence provides customised reports and data research which deliver vital business intelligence to corporations, investment promotion agencies, economic development organisations, consulting firms and research institutions.
Find out more.


